How to measure content performance: Content marketing metrics
Contents

Content marketing metrics
Content is more than just ‘king’—it’s the entire kingdom! Understanding, measuring and refining your content marketing strategy is crucial for staying ahead. This blog is designed to be your go-to for analysing your content marketing metrics. We will help you unlock the metrics you need for your content to soar to new heights. We aim to provide actionable insights, expert tips and practical tools to help you elevate your content performance.
Content isn’t just blogs and social posts
Before we look at the specific content marketing metrics, let’s talk about your B2B content marketing. B2B content comes in various forms, including, but not limited to; social media posts, blog posts, articles, case studies, white papers, reports, videos, infographics, podcasts and webinars.
It is also worth noting that content marketing programmes are more fluid than advertising campaigns. Calculate advertising ROI by dividing the activity cost by the number of leads or qualified leads, also known as cost per conversion (CPC)
This simplified calculation is not the only way to measure the success of your content marketing programme.
What is a content marketing metric?
Content marketing metrics are essential measurements that assess the impact of your content marketing. They provide valuable insights into how well your content meets your objectives and KPIs, such as boosting engagement, driving traffic and generating qualified leads.
They also offer insights into audience response and the overall impact of your content, making them crucial for assessing success. So, don’t underestimate their value!
15 Important content marketing metrics you should analyse
It is essential to understand that assessing the success of your content marketing campaigns requires you to measure various content marketing metrics, or how else will you know what success truly looks like?
We will start with some basics, and then work our way through some additional content marketing metrics we think you should be analysing.
1. Engagement levels
Content marketing engagement metrics are a great way to measure how your audience values your content marketing.
Examine engagement levels across all forms of content by asking yourself these questions…
- How many people are reading and interacting with your blog content?
- Are they leaving comments and sharing your social media posts?
- Are they watching the complete video or just the first 10 seconds?
These are all indicators of engagement, it’s the valuable data which helps you assess your content’s effectiveness.
Tracking engagement over time allows you to identify what type of content and which formats resonate most with your audience, as they progress through the content marketing funnel. Understanding how your audience engages with your content is the key to maximising its effectiveness.
Essential Recommends
When it comes to engagement, the regularity of tracking content marketing metrics is largely dependent on the format and platform you are working with. We recommend tracking the following overview metrics, monthly;
- Blog content metrics would include impressions, comments and shares.
- LinkedIn posts overview content metrics will include impressions, reactions, comments, reposts and page followers
- Meta business suite overview metrics will include reach, content interactions, followers and link clicks
When reviewing content formats across social media, we recommend you review each post type weekly. This helps you identify which content format your audience favours.
- Text and image-based social post metrics include impressions, reactions, comments and reposts/shared
- Rich media social posts such as Reels or Carousel metrics will include impressions, reactions, comments, reposts/shares
- Video content (regardless of platform) metrics will include views, view time, reactions, comments and reposts.
2. Bounce rate
The opposite of an engagement metric would be the bounce rate. This is where a user comes onto a page, and immediately leaves. The bounce rate on a specific page is a clear indicator of engagement.
If you have a low bounce rate, it indicates your audience is spending time on this page.
A high bounce rate would indicate that your audience has come to your page, and left quickly. This means the engagement level is low, and your audience has not found what they need on your page.
Google Analytics
It is worth pointing out that Google Analytics moved to GA4 this year, and they do not display, as prominently, bounce rate metrics. The bounce rate for landing pages should be monitored, at least, monthly. However, if you run specific landing pages as part of a campaign, we suggest you review this weekly. The simplest way to access the bounce rate is to;
- Log in to Google Analytics
- On the left-hand menu, select ‘Reports’
- Select the report you want to customise
- Click ‘Customise report’ in the upper-right corner of the report. (If you don’t see the button, you don’t have the Editor or Administrator role.)
- In the ‘Report data’ section of the right panel, select ‘Metrics’
- Add ‘Bounce rate’ and click ‘Apply’
- As we recommend monthly reporting, we suggest you select ‘save changes’ to the current report
3. Website traffic & audience growth
Audience growth is a key metric in understanding your content’s effectiveness! A rise in ‘new’ visitors highlights that your content is attracting and engaging a wider audience. Returning visitors are just as valuable as it denotes that your content is valuable enough to bring people back.
Traffic sources (such as search engines, social media, direct, referrals) will also help you here – It will guide you in understanding where the increase, or decrease, is coming from.
Increased website traffic because of your content marketing efforts is a positive sign that your content resonates with your target audience. It indicates that your content reaches a wider audience and drives brand awareness.
Organic search traffic landing on your website shows that your visitors are finding the answers to their queries. Search engines, over time, reward this behaviour by increasing your website’s page/domain authority, raising you in the Search Engine Results Page (SERP).
Monthly analytics
We recommend monthly metric reporting to understand your traffic and audience growth. Using Google Analytics we recommend you track the following metrics
- Sessions – A period of time when a user interacts with your website. It starts when a user arrives on your site and ends after 30 minutes of inactivity or when they leave your site.
- Engaged Sessions – An engaged session is a session that is considered engaged. i.e., if it lasts longer than 10 seconds, has multiple page views, or results in a conversion.
- Users Users are individuals who visit your website.
- New Users New Users are users who visit your website for the first time. This is a subset of the ‘Users’ metric.
- Views Views typically refer to “Page Views,” which count the total number of times a page on your website is viewed.
We want to add a note of caution here, the impact on your organic web traffic can vary based on the success of your SEO efforts and the visibility of your content in Google’s featured snippets and other search features. We discuss this later in the post, so keep on reading!
4. Volume of impressions
Impressions represent the total number of times your content has been displayed to your audience. However, this doesn’t necessarily mean it was by different people.
A high number of impressions suggests your content is gaining visibility, marking a good start in its performance journey. However, it’s important to distinguish between impressions and unique impressions.
Unique impressions refer to the number of individual users who have seen your content. This metric helps you understand the reach of your content—how many people are being exposed to it.
In contrast, total impressions count every view, including repeat views by the same person. This indicates how memorable or engaging the content is, as users return to view it repeatedly.
5. Conversion metrics
Conversions refer to any action a user takes, as a result of your content. With increased traffic, you should (ideally) see a rise in conversions, this indicates that your content is effective.
Measuring conversion rates and click-through rates (CTRs) are great content marketing metrics to measure. They can help to better understand the impact your content is having in line with your business goals and KPIs.
There are a multitude of actions that can be monitored but some of the most common conversions to track are:
Call-to-actions conversions
Call-to-actions (CTA‘s) are usually the buttons added to a page to drive your audience to take an action, such as contact us, request a demo, download or read more. The metric is a simple calculation of CTA completions divided by page views (and multiplied by 100 for a percentage).
Email engagement rates
- Metrics to monitor are ‘views’ of the newsletter sign-up page, and the number of ‘completed’ registrations. You can then calculate the conversation rate by dividing the number of completed registrations by the number of page views, then multiply by 100. 15 sign ups / 1000 page views *100 = 1.5% conversion rate
- To monitor your database of data, we recommend you track the following monthly metrics; the number of new sign-ups, and the number of unsubscribed – Seeing these numbers over time will highlight the peaks and troffs of your data so you can investigate what drove those changes
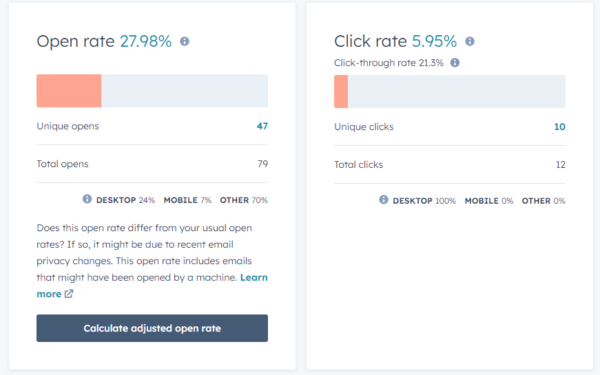
- When sending email marketing, your metrics include ‘open rates (OR)’ and ‘CTR’ as this will indicate what is working and what is not. i.e., low open rates would indicate your subject line is not as appealing as you thought. A low CTR rate would indicate that your audience isn’t interested in the content of your email. Or that it was not presented appealingly. Most email platforms will calculate the OR and CTR for you in their dashboards. Like this:
- Open rates is the % of your audience who open your email compared to the number that was delivered
- Click rate is the % of your audience who clicked on your email content, compared to the number that was delivered
- Click-through rate is the % of your audience that clicked on your email, compared to the number that was opened
Form submissions, downloads and gated content
- Metrics to monitor are ‘views’ of the page and the number of ‘completed conversions’. If you have high views of the page, but few conversions, it indicates a problem with your user journey.
Top tip – If you have high views of the page, but few conversions, it indicates a problem with your user journey. Look for obstacles that might prevent users from completing their journey, such as complicated forms or confusing navigation. For instance, if you use gated content, the issue might be your form. If it’s asking too many questions or is too time-consuming. This can frustrate users, causing them to abandon your content and seek solutions elsewhere.
The goal of conversion is to make it easy for potential customers to engage with your business. Ensure that your process is smooth and user-friendly, rather than a source of frustration. This is especially important for lead generation.
6. Brand Awareness
It starts with understanding what your brand awareness goals and KPIs are.
Brand awareness metrics will help you measure how well your content is promoting your brand and increasing your brand visibility. You can look at how many people search for your brand name in Google Analytics. Or, you can run brand awareness surveys to ask your audience how well they recognise your brand.
With social media, you can monitor metrics such as
- social media mentions – how many times your company has been tagged online
- shares – how often your content, pages or posts are being shared or reposted
- search engine rankings – how many users are searching for your company name
7. Brand Sentiment
A word of caution. Brand sentiment also needs to be analysed along with brand mentions. While you might see a sudden increase in brand mentions on social media platforms, understand whether the sentiment is positive or negative. An increase in social media mentions will be harmful if they are all about a negative experience.
8. Keyword Rankings
SEO metrics such as keyword ranking are just as important.
Understanding where your keywords and phrases are ranked, and then monitoring and optimising them to increase their position in the SERP is a key metric. By reviewing your content position in the rankings, you will be able to identify how effective your content has been allows you to optimise your content for maximum gains.
Using Google Search Conole (GSC), or a tool like SE Ranking (which is connected to your GSC) you can see which search terms you are ranking for, and what position you rank. Monitor these monthly. You can optimise your existing content to increase its position in the SERP. Or, you can identify keywords you are not ranking for but want to.
Remember, your content should be optimised for SEO. If you have written great content around a specific set of keywords, you need to monitor the changes in the SERP. The changes in position will indicate how well your content answers the user’s search query.
Interesting fact
An estimated 75% of all clicks go to the top 3 organic results so, it is more important than ever, to get your business positioned at the top of the SERP.
9. Google features
Securing additional SERP features and optimising for them will indicate that your content is performing well. When you secure these placements, it is because your content answers the users’ search queries, better than others online.
Featured snippets are answers that appear at the top of Google’s search results, that relate to the user’s search query.
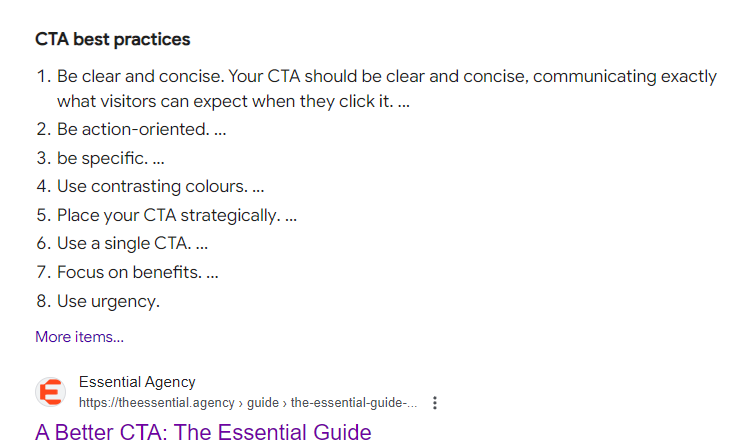
Rich results are normal search results that display additional information such as reviews and ratings.
People Also Ask (PAA) are related questions to the original search query, that is answered directly. This usually sits below the main search result.
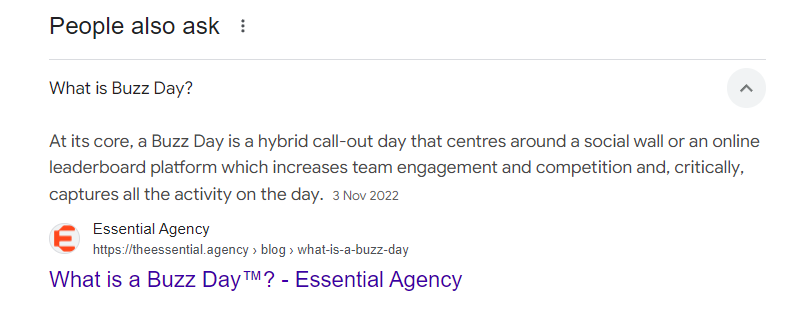
These feature metrics can be found in Google Search Console or SE Ranking. To find this in SERanking,
- Log in and go to ‘Projects’
- In the left-hand menu, under ‘Rankings’, click on ‘Detailed’
- On the central dashboard, you will see a tab for ‘SERP Features’
Your traffic metrics may see significant changes as you secure spots on these features because these features greatly influence how users interact with search results.
The positive is that you could see a substantial increase in traffic if you are cited in the snippet, as your content is featured prominently. On the flip side, if the snippet answers the search query fully, it reduces the need to click on the link – This will lead to lower traffic.
Although not a feature, Google’s new Generative AI may also be present when your user inputs a search query. If the AI overview displays all the relevant information the user needs in the search results, then users have no reason to visit your website.
10. Content Scoring
At The Essential Agency, we score content against grammar & spelling, readability, SEO, AI use, customer focus and writing style. We use this content audit to determine the quality of the actual writing.
Would like us to audit your content?
Content scoring, however, is a process that goes beyond assessing the quality of your written content.
It entails analysing and comparing your content with that of your competitors. This allows you to uncover areas for improvement, and implement strategies to gain a higher score.
By using tools and analytical platforms just as SE Ranking, you can gain valuable insights into the content scores of your competitors’ blog posts and articles, allowing you to craft content that will give you that competitive edge.
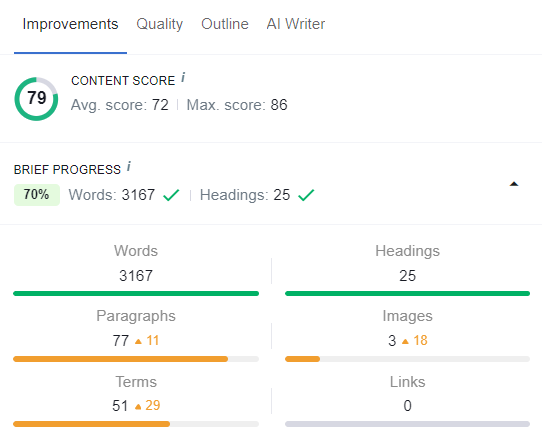
The SE Ranking tool compares and scores content using the following metrics:
- Number of words
- Number of paragraphs
- Number of headings
- Terms used
- Number of questions asked, and answered
- Inclusion of keywords and the ratio used
11. Page Authority
Page Authority (PA) is a metric that predicts how well a set page is likely to rank in SERP. it works on a scale from 1 to 100, with higher scores indicating a greater likelihood of ranking well. Monitor your key page PA, and optimise the page to increase the score.
Each page will have its own PA, using a tool such as MOZ you can easily access this information. Track your score over time and then optimise the pages to increase the score.
Essential Recommends
Focus your attention on your key services pages and your key landing pages. Trying to work on every page will be very overwhelming, especially for websites with thousands of pages.
12. Domain trust
Domain trust (DT) is a metric that reflects the credibility and trustworthiness of a website, it takes into account the entire domain and subdomains.
The higher the DT, the more reliable and authoritative it is. Monitoring your DT, and optimising it for growth will lead to greater visibility and potentially higher engagement rates.
Using a free MOZ account, you can establish your domain authority and track it over time.
13. Back Links
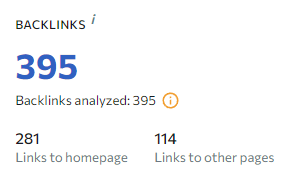
Monitor the number of strong, positive backlinks. Quality backlinks from authoritative websites boost your content’s value and improve your SERP ranking, while spammy links can harm your site’s authority.
We use SE Ranking to track backlinks. Log in, select ‘Backlinks’ from the left-hand menu, and view the dashboard to assess the quality of your links. Good backlinks come from respected, engaging sites, while bad links are from toxic domains like spammy websites or link networks.
By monitoring the number and quality of backlinks, you can identify opportunities to strengthen your site’s authority, improve search rankings and address any harmful links that could negatively impact your SEO.
14. Reviews
Reviews, both company-based and product-specific, can significantly impact your website’s visibility, traffic and audience insights.
A high rating and numerous positive reviews increase the likelihood of users clicking on your listing in the SERP, which can boost your CTR and conversion rates. A higher CTR signals to search engines that your website is relevant and valuable, potentially improving your rankings.
Reviews also provide valuable feedback on how well your content resonates with users, similar to gauging brand sentiment. Analysing both positive and negative reviews offers insights into user experiences, helping you identify successes and challenges. Regularly assessing these reviews allows you to optimise your content in real time.
Addressing negative reviews proactively can turn them into positive ones, further supporting your business goals and enhancing your brand’s reputation.
15. Subscriber growth
Remember we started with conversions, and one of those conversions was newsletter sign-up. Subscriber growth is a great content marketing metric to monitor. It refers to the increase in the number of people who sign up to receive your content regularly, such as email newsletters, blog updates or social media channels.
The impact of subscriber growth on your content marketing performance is plentiful. A growing subscriber base means more people are regularly exposed to your content, expanding your reach and potential influence. And, more subscribers typically lead to higher engagement rates, as your content is delivered directly to those interested in it, increasing the likelihood of clicks, shares, and interactions.
With a larger, engaged audience, you have more opportunities to convert subscribers into paying customers, driving sales and revenue.
It also improves your SEO, as consistent engagement from a growing subscriber base can signal to search engines that your content is valuable.
Conclusion
We hope this blog acts as a guide to help you analyse your content marketing strategy and help you raise your content marketing performance.
Content marketing optimised for SEO is a long-term strategy and effective content marketing measurement goes beyond simple metrics.
By analysing engagement, conversions, and brand awareness, you gain a clear understanding of your content marketing’s true impact.
Tracking key metrics like bounce rate, impressions, sentiment and keyword rankings allows you to fine-tune your strategy for maximum results.
Ultimately, you need to ensure your content marketing strategy speaks directly to your target audience. It should be engaging and aligned with your core objectives and business KPIs. When combined, it gives you a clear understanding of your content’s impact.
Remember, you don’t have to always start with something new, we recommend you work on content optimisation, improving content you have already written.
We can get you started, with a free, no-obligation content audit…
Want to know more about Essentials Kick-Ass Content service?
You do, thats great! Take a look at our Content Marketing FAQs
Content marketing metric tools
At The Essential Agency, we use a variety of tools to measure content marketing metrics – not only for our marketing but for our clients too!
- Content audit by Essential
- Google Analytics
- Google Search Console
- LinkedIn – To access your analytics: Go to your ‘Page Admin’ view and click ‘Analytics’ in the left-hand menu
- Meta Business Suite
- MOZ
- SE Ranking